Fieldpartner update October 2023
- Ricardo Gallardo
- Nov 11, 2023
- 1 min read


New visualization

We completely changed the way the indexes are displayed with a new presentation, more user-friendly and with more information.
We incorporate the visualization of the data from the sensors you have in the lot or field you want to examine, placing the mouse over the sensor, it will display the data read from it.

The bar at the bottom of the page allows us to choose the index we want to work with, as well as the dates of the images available in the system.
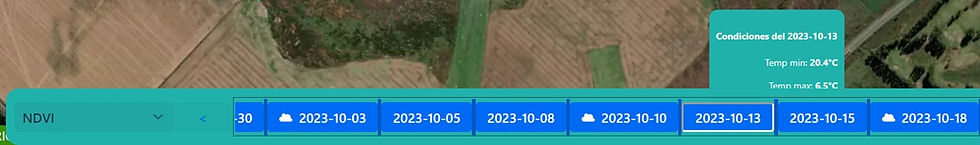
When choosing the day, the maximum and minimum temperature conditions of the day will be displayed. This data can be from the QTS Agro Meteometer weather stations or, if you do not have a meteorology station, we incorporate meteorological data from a platform. The data from the platform will not have the precision of our plants since they are estimated and not measured on site.
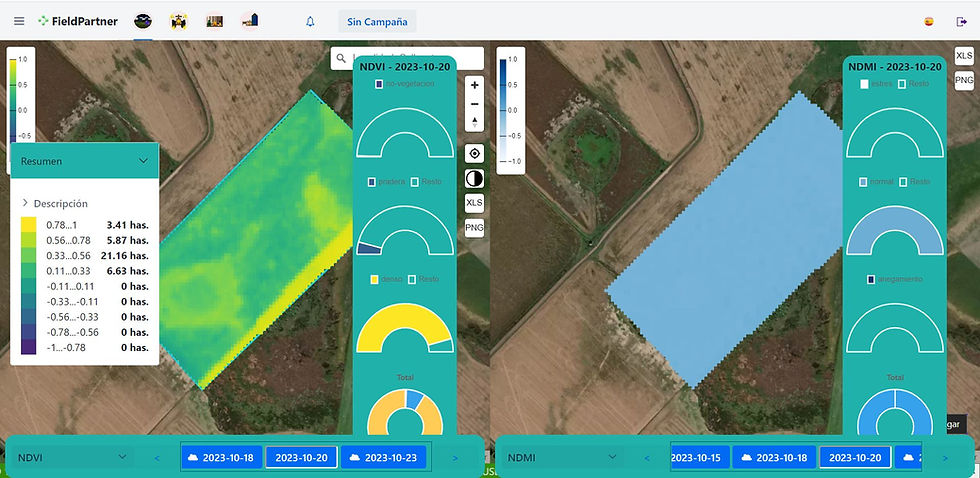
New color scale by index, display of pixel value when passing through the image.
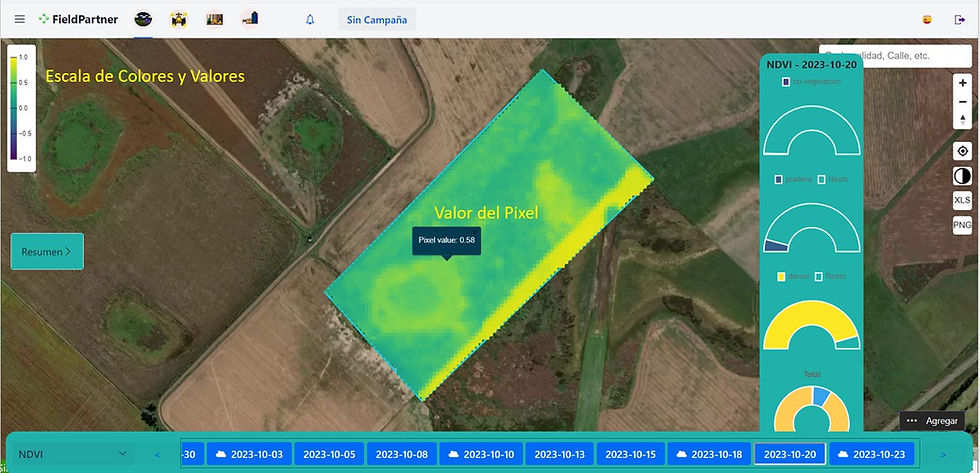
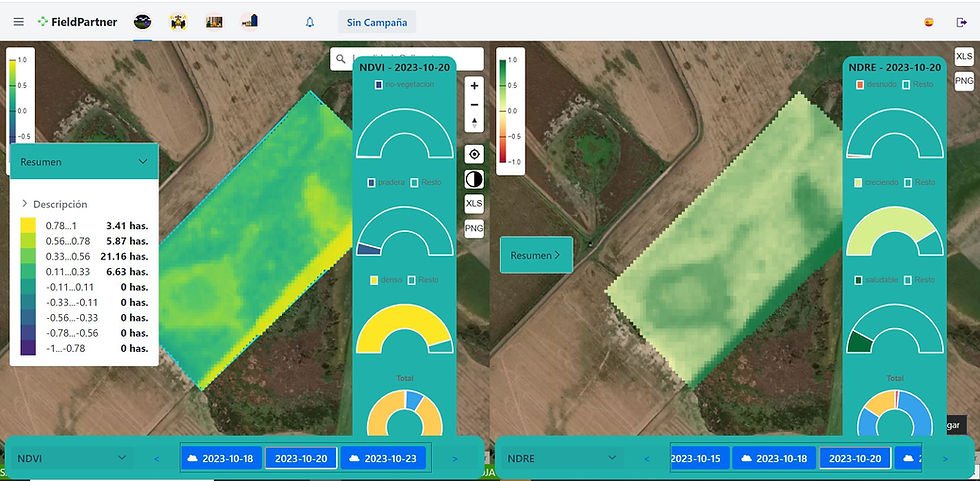
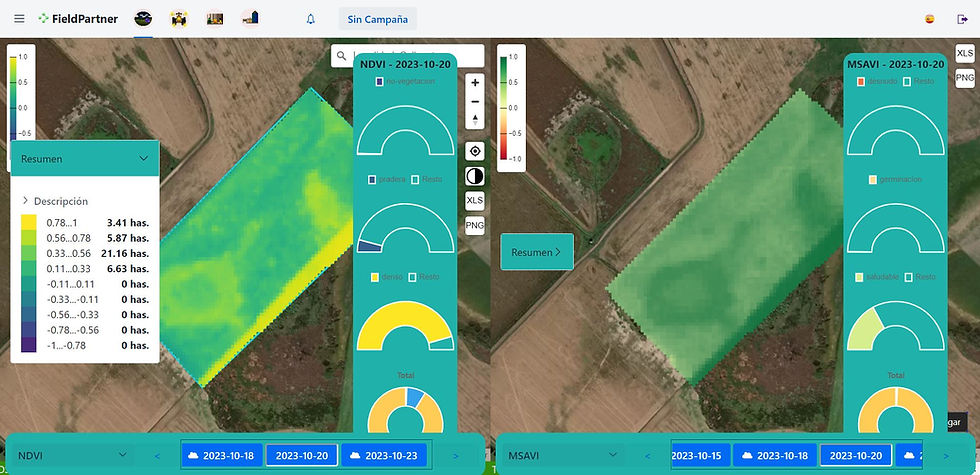
We incorporate a new percentage summary of values based on the area of the lot
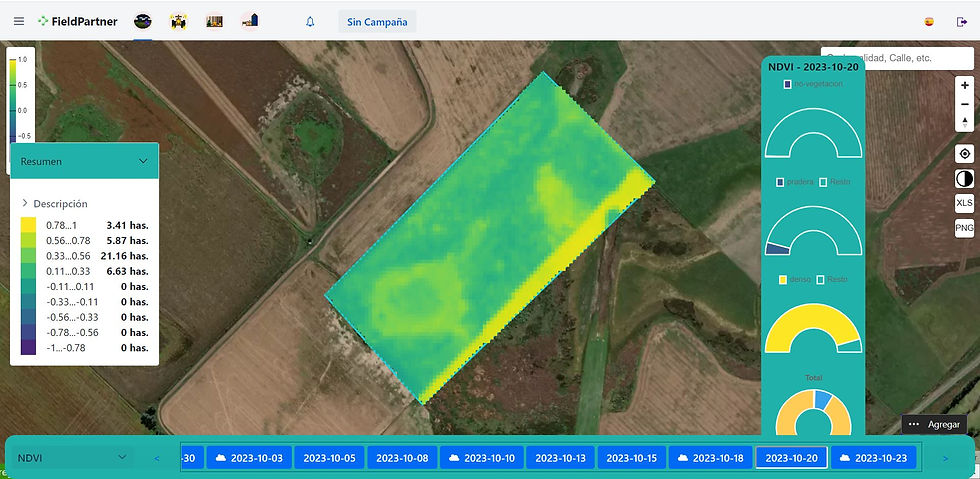
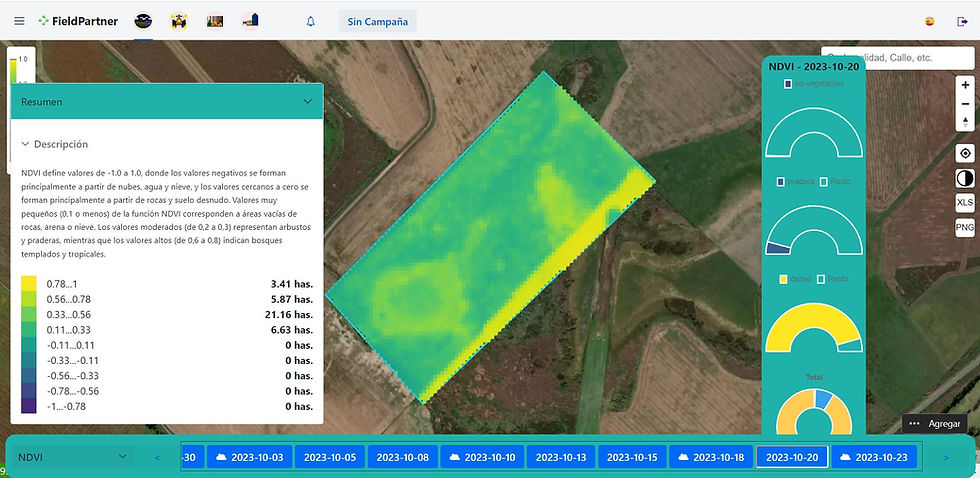
In the summary you will also be able to access a brief description of the index you are using or have selected.
Comparison of evolution of the same index as a function of time:
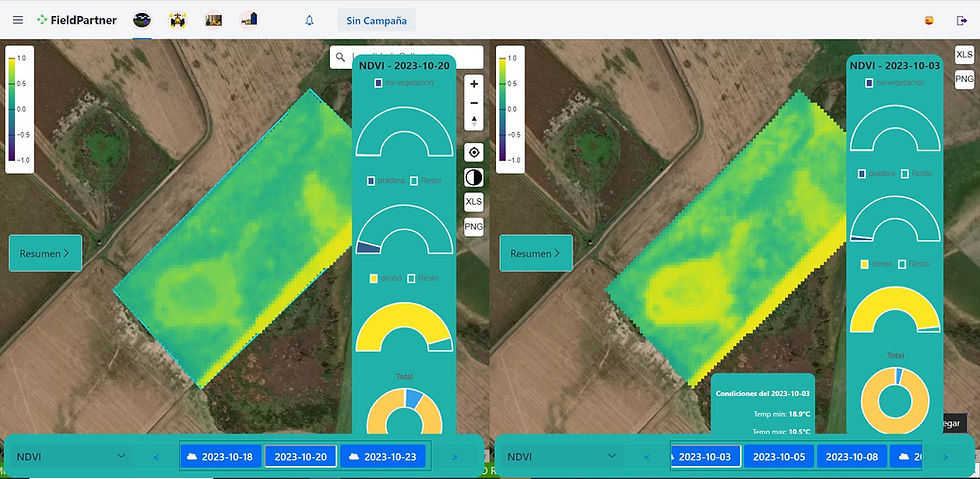
We can see the same comparison with the summaries of each image and thus have a better perspective.

Visualization of different indices among themselves using the same image or images belonging to different days.
Incorporation of new indices
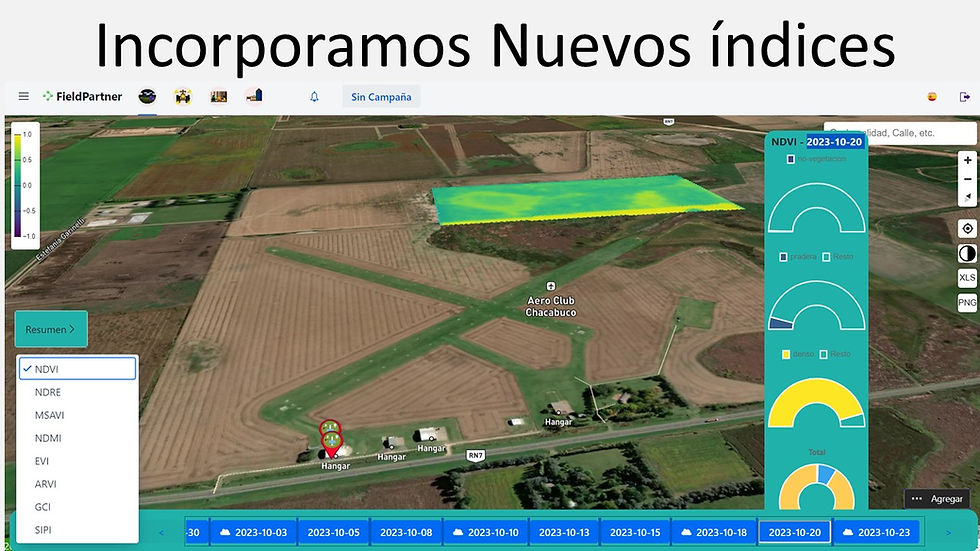
Indices have been incorporated
EVI
ARVI
GCI
SIPE
We maintain the NDVI, NDRE, MSAVI, NDMI indices
This video shows the new interface and functionalities.
.


